Single URL
Single report with focus
Executive summary, findings, action plan and technical details for exactly one page.
risk:clear summary:yes evidence:linked
Website audit with clear signals instead of metric noise
auditmysite audits eleven modules: Accessibility, SEO, Performance, Security, Mobile, UX and Journey – plus AI Visibility, Source Quality, Dark Mode and Tech Stack. Instead of a metric carpet you get prioritized signals, clear reports and JSON artifacts for automation.
Outputs
PDF, JSON, History
Engine
Chrome CDP + real signals
Scope
Single URL to Sitemap
$ auditmysite https://example.com Install Content Signals
User-Agent
Content-Signal
Audit-Focus
Signal Logic
Accessibility stays the core signal. SEO, Journey and UX are not isolated, but added as a readable layer on top.
Report Goal
A report should make decisions easier, not create additional noise.
Batch / Sitemap
Compact domain patterns, rankings and prioritization instead of a wall of individual findings.
# Default: terminal summary + PDF/JSON/history in the current directory
$ auditmysite https://example.com
✓ PDF: ./example-com-2026-04-03-standard.pdf
✓ JSON: ./example-com-2026-04-03-standard.json
✓ History: ./example-com-history.json

# JSON output for CI/automation
$ auditmysite https://example.com -f json -o report.json --quiet

# Base URL: detect sitemap and start a batch audit directly
$ auditmysite https://example.com --prefer-sitemap
This project is actively growing. First results are already usable – some areas are still being built out.
Modules
The modules are not built as a feature list with equal weight. Five modules deliver measured browser signals, six heuristic indicators show tendencies – clearly separated in the report.
What you get
77 automatically checkable WCAG rules at axe-core level via Chrome DevTools Protocol. Real browser signals, no static parsing. Not a substitute for a full manual audit – but the foundation for systematically finding detectable issues.
Signal Focus
Contrast · ARIA Validation
Contrast ARIA Validation Landmarks Forms & Labels Meta, heading structure, structured data, page profile and tracking/external services.
Signal Focus
Title & Description · Structured Data
Title & Description Structured Data Content Profile Tracking / Zaraz Core Web Vitals with concrete recommendations derived from the measured signals.
Signal Focus
LCP · CLS
LCP CLS TBT DOM Size Security headers, SSL/TLS analysis and concrete follow-up actions from missing policies.
Signal Focus
CSP · HSTS
CSP HSTS COOP / CORP Referrer-Policy Viewport, touch targets and responsive checks.
Signal Focus
Viewport Config · Touch 44x44px
Viewport Config Touch 44x44px Font Sizes Horizontal Scroll 5-dimension analysis: CTA clarity, visual hierarchy, content clarity, trust signals and cognitive load.
Signal Focus
CTA Clarity · Visual Hierarchy
CTA Clarity Visual Hierarchy Trust Signals Cognitive Load User flow analysis: entry, orientation, navigation, interaction and conversion – weighted by page type. Indicator score – tendency, not a measurement.
Signal Focus
Entry Clarity · Orientation
Entry Clarity Orientation Navigation Conversion Structural readiness for LLM indexing and citation – readability, citability, structured data, AI policy and chunk quality. Indicator score – tendency, not a measurement.
Signal Focus
Readability · Citability
Readability Citability Structured Data Chunk Quality Code hygiene signals: inline styles, deprecated elements, semantic structure and asset hygiene. Indicator score – tendency, not a measurement.
Signal Focus
Inline Styles · Deprecated Elements
Inline Styles Deprecated Elements Semantic Structure Asset Hygiene Detects dark mode support via prefers-color-scheme media queries and CSS custom properties. Indicator score – tendency, not a measurement.
Signal Focus
prefers-color-scheme · CSS Custom Properties
prefers-color-scheme CSS Custom Properties Detects CMS and frameworks (WordPress, Next.js, Astro, React, Vue etc.) via in-page signals and runs stack-specific security probes. Enabled with --stack or --full.
Signal Focus
CMS Detection · Framework Detection
CMS Detection Framework Detection Security Probes Version Disclosure Content Signals
A calm surface with fine borders, monospace chips and a clear reading order. This fits auditmysite because the product itself is meant to bring order to signals.
Single URL
Executive summary, findings, action plan and technical details for exactly one page.
Sitemap / Batch
Rankings, averages, patterns and priorities instead of a full report for each subpage.
Perfect for
Not just for technical audits, but for handoffs, prioritization and reliable communication between tech, content and business.
Developers & DevOps
Reproducible audits, JSON artifacts and clear handoffs into CI/CD pipelines.
Agencies
Condensed reports for prioritization, PDF exports for clients and solid individual analyses.
Freelancers
Quick initial analyses for acquisition and a calm, traceable report for follow-up projects.
Marketing & Content
SEO, UX and Journey signals without tool sprawl or disconnected individual metrics.
Three steps from invocation to a complete report.
Pass a single URL. For base URLs, auditmysite probes common sitemap locations and can suggest a domain-wide run.
auditmysite https://your-site.com auditmysite runs the audit in a real browser via Chrome DevTools Protocol – no extension needed.
Single reports stay deep and page-specific. Sitemap reports stay compact by default, but can generate one report per URL when needed.
Pass a single URL. auditmysite probes common sitemap locations and can suggest a domain-wide run.
auditmysite https://your-site.com Runs in a real browser via Chrome DevTools Protocol – no extension needed.
Single reports are deep and page-specific. Sitemap reports stay compact by default.
Single pages are intentionally detailed. Sitemap and batch scans stay condensed by default, but can switch to one report per URL with --per-page-reports.
Single URL
Risk assessment with executive summary, unified problem blocks, action plan with effort and scope, and technical detail blocks for one specific page.
Sitemap / Batch
Average values, URL ranking, common issues, action plan with effort and scope, URL matrix with business relevance and content-SEO potential.
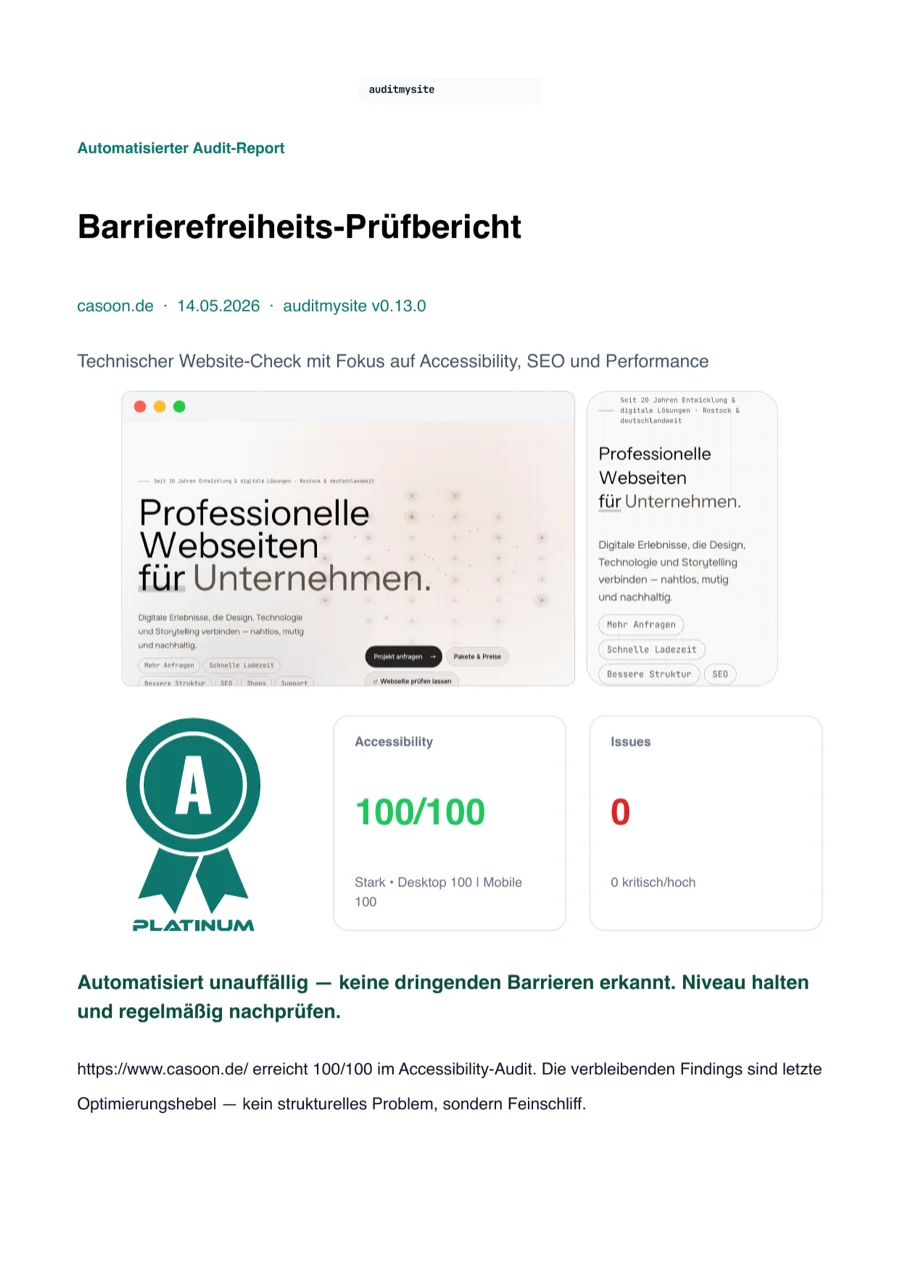
Report Preview
The first page gives decision-makers everything they need: overall score, risk level (Platinum–Critical), maturity stage and a module overview. No scrolling through raw findings required.
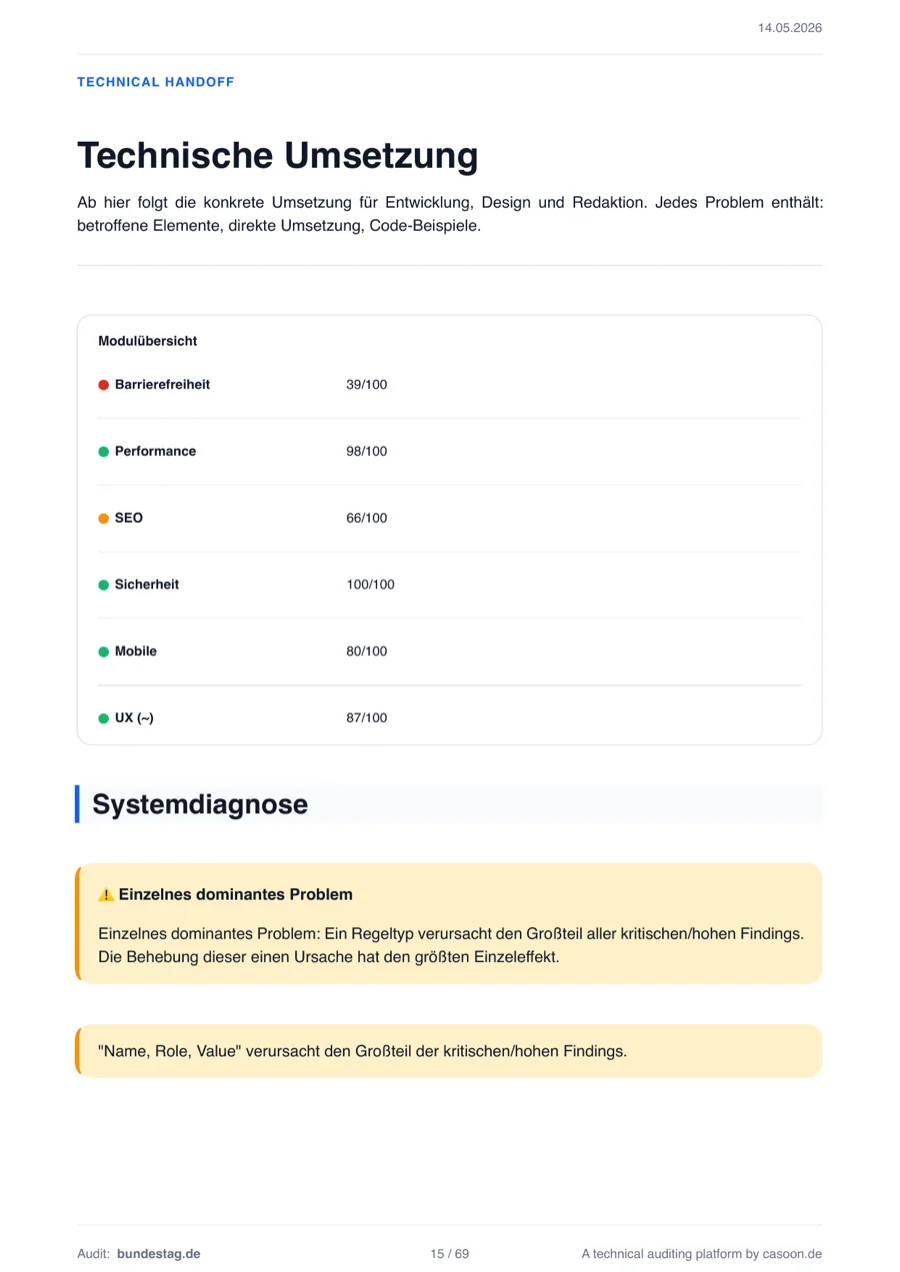
Each module gets its own score. The breakdown shows which areas hold potential and where critical findings cluster. Heuristic indicator modules are clearly marked.
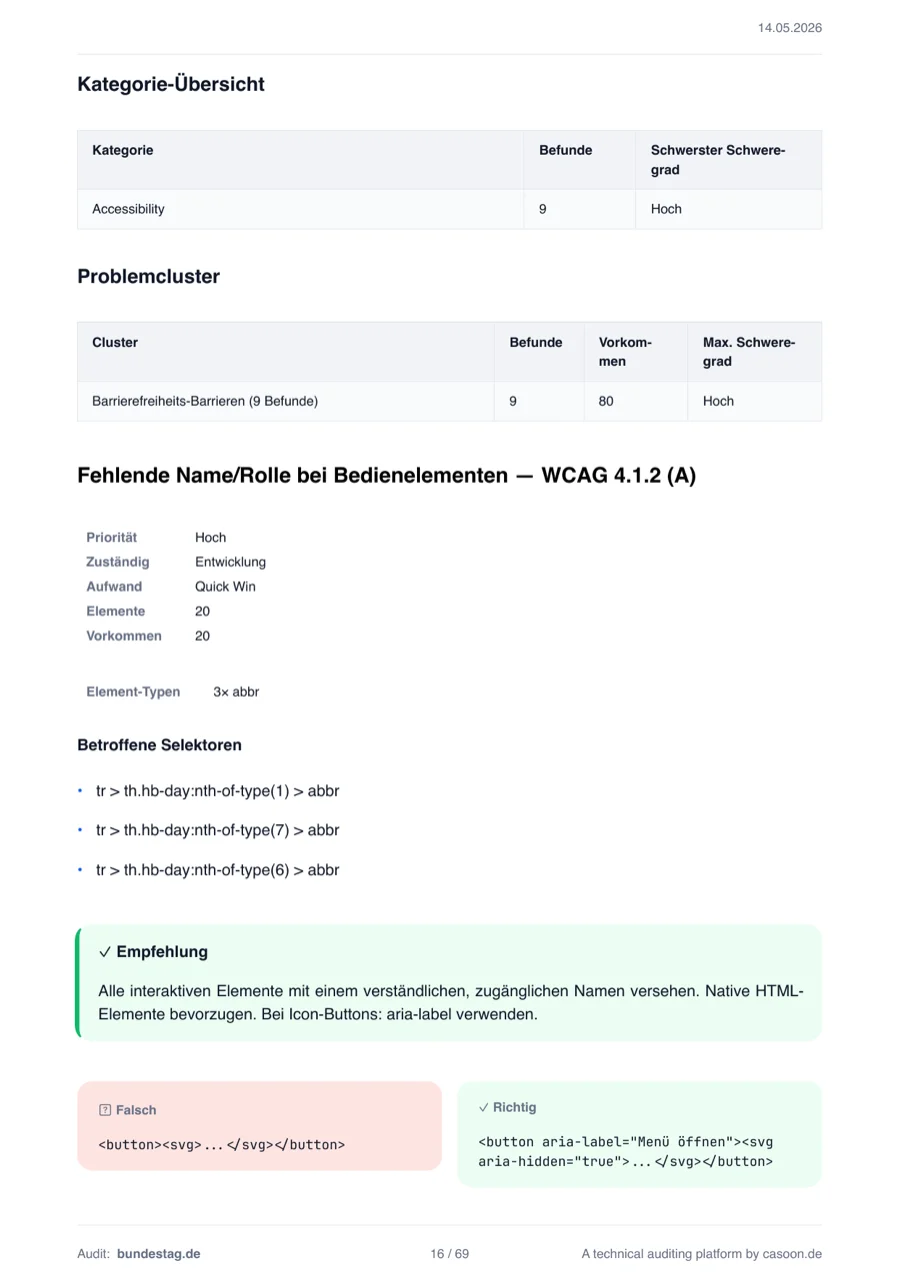
Every finding shows the WCAG criterion, impact level, affected selector and a concrete fix suggestion. Not just 'something is wrong' – but exactly where and how to fix it.
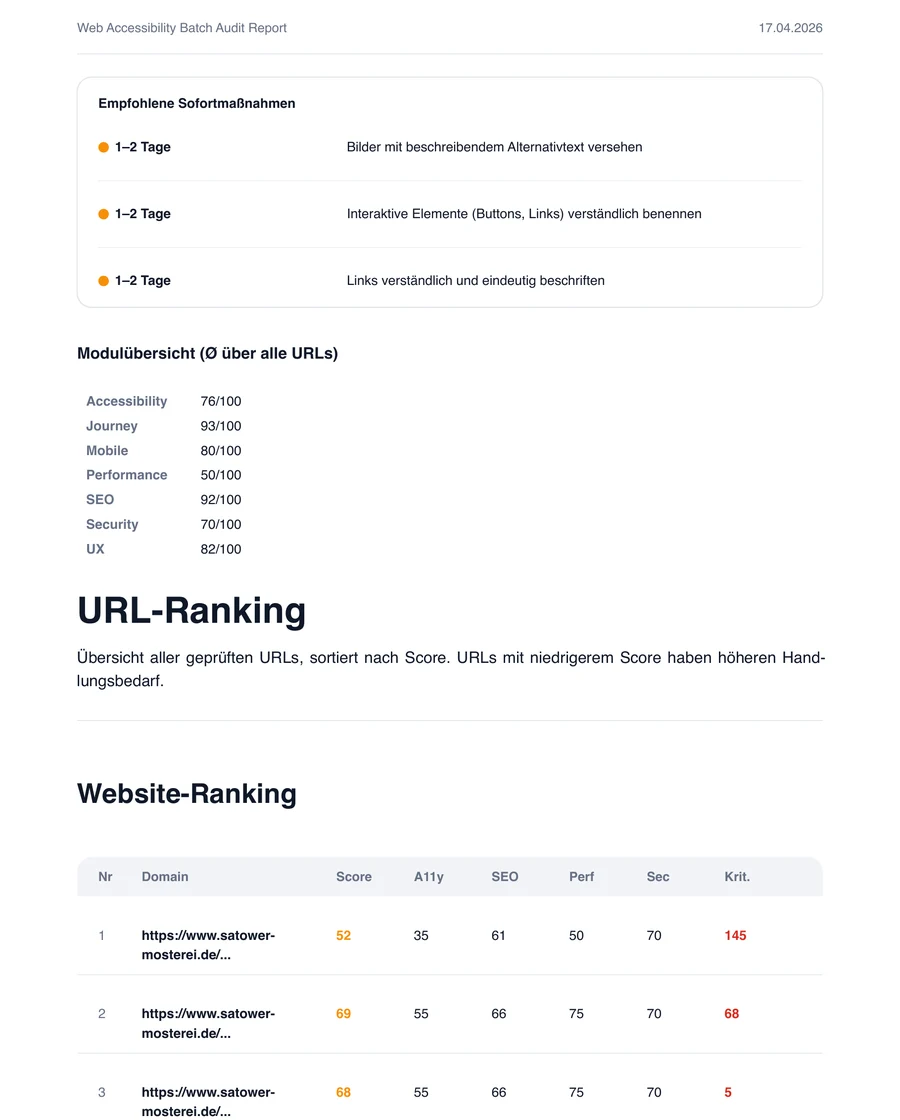
Sitemap reports stay compact. The URL ranking shows all scanned pages sorted by score – so you see immediately where the most critical issues cluster across the domain.
The Desktop App
Same audit power with a graphical interface. Built on Tauri v2 + Astro + Svelte. Currently in active alpha development.
--per-page-reports, auditmysite scans a sitemap or URL list and
writes a dedicated report for each URL. That is
useful when you want sitemap breadth with
single-page depth.
auditmysite https://example.com creates a terminal summary, a PDF, a JSON artifact and
a history file. For automation, you can explicitly switch
between JSON, table and PDF. With -f ai you get an LLM-optimised task list — sorted by impact, ready to use as context for AI-assisted code remediation. With -f summary you get a compact dashboard JSON with score, grade, medal, issue counts, and the top 10 findings.
auditmysite analyses live – directly against the browser. @casoon/astro-post-audit is the static counterpart: an Astro plugin that checks canonical URLs, heading hierarchy, meta tags, Open Graph, skip links, sitemap and fragment links at build time. No external services, no runtime overhead.
View post-audit